

ID: 2225/10-Statistics
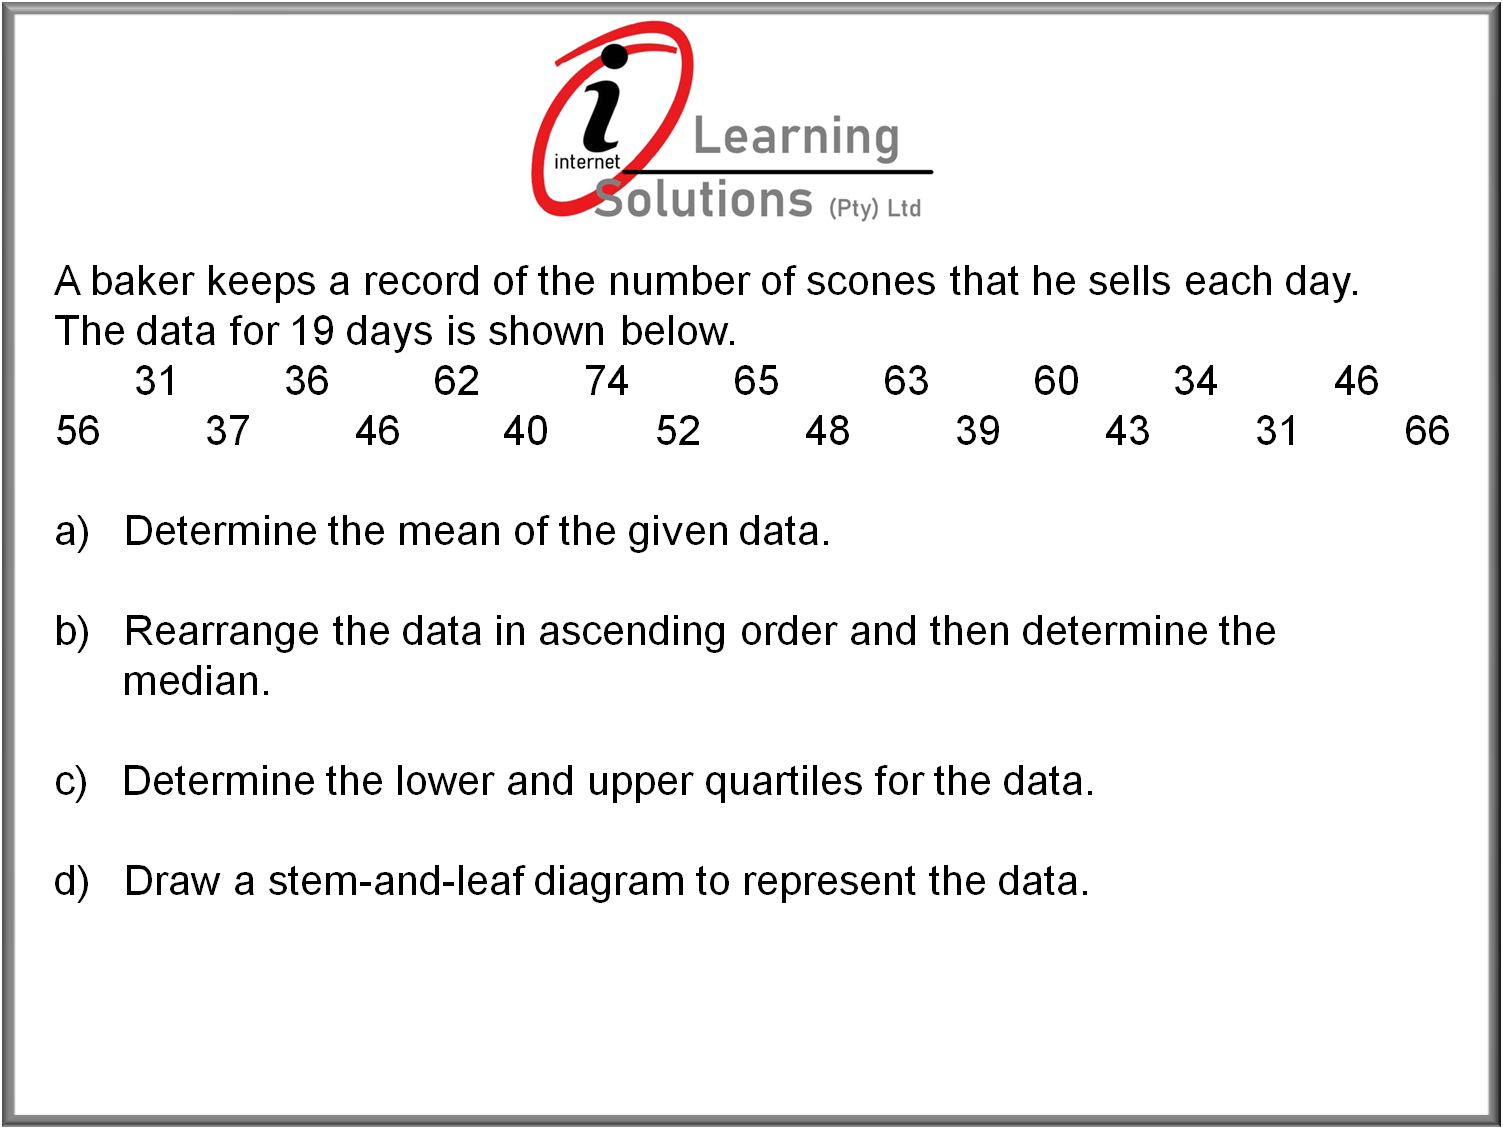
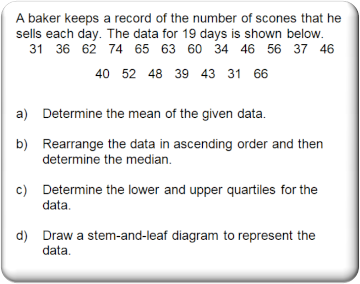
Titel: Determine the mean, mode and median, as well as the quartiles, of a set of odd-numbered data points, and then also represent the data on a stem-and-leaf-plot
Keywords:
Data handling



ID: 2326/10-Statistics
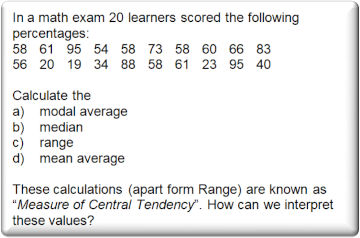
Titel: We discuss the mean, mode and median for a set of data, and then also do an interpretation of this data by discussing the differences of these tendencies
Keywords:
Central Tendency | range | measure of dispersion | modal average | mean average


ID: 2043/11-Statistics
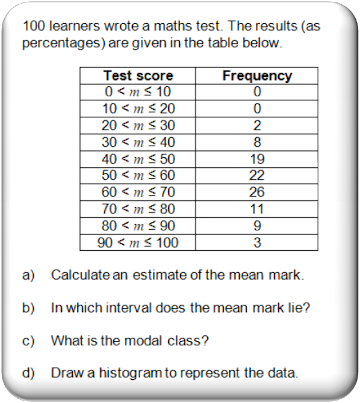
Titel: Interpret data from a table of class intervals, and calculate some values as well
Keywords:
Estimated mean | modal class | histogram



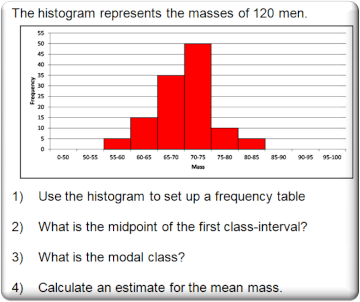

ID: 2046/11-Statistics
Titel: Interpret data from a histogram and answer some questions
Keywords:
Frequency table | midpoint of an interval | modal class | estimated mean




ID: 2049/11-Statistics
Titel: Five point summary and box-and-whisker plots
Keywords:
Quartiles | median | minimum | maximum | Q1 | Q2 | Q3 | range




ID: 2052/11-Statistics
Titel: Align the box-and-whisker plot with a set of supplied data
Keywords:
Quartiles | median | minimum | maximum | Q1 | Q2 | Q3 | range




ID: 2056/11-Statistics
Titel: Interpret and compare data from a double box-and-whisker plot
Keywords:
Quartiles | median | minimum | maximum | Q1 | Q2 | Q3 | range







Grade 10: Statistics
Baseline tests:
Below all our online tests are listed. Click on the one that you have been enrolled for. You can also go back at any time to redo previous tests that you were enrolled for (we strongly
recommend that!)
Videos:
Below we list the
videos from our Back to Basics database. When you are enrolled with us you can click on any of the questions to see the video memorandum
Click on the "Play" button




Jimmy's 1% Law:
Spend 1% of your day (that is about 15 minutes) to work through these videos and Baseline tests, and your Maths will surely improve!
Statistics
Scope:
Scope:
- Grouped data
- Mean estimate
- Modal class
- Histograms
- Frequency table
- Box and whisker plots
- Five number summary


Statistics
Scope:
- Histogram and data-analysis of data that is estimated by being given in intervals

Statistics
Scope:
- Interpret a histogram and answer some questions about the estimates of the class-intervals

Statistics
Scope:
- Compile a graphical five-point sumamry of given data, and then asnwer questions to illustrate your understanding of this representation

Statistics
Scope:
- A unique way of illustrating your understanding of the box-and-whisker plot

Statistics
Scope:
- Interpret the given box-and-whisker plots to answer questions about the data
ID: 2041

ID: 2044

ID: 2047

ID: 2050

ID: 2053

ID: 2057