
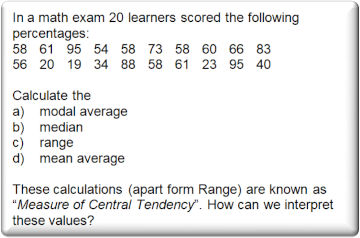

ID: 2326/8-Statistics and Data
Titel: We discuss the mean, mode and median for a set of data, and then also do an interpretation of this data by discussing the differences of these tendencies, as well as the range which is a measure of dispersion (modal average ; mean average)
Keywords:
Central Tendency


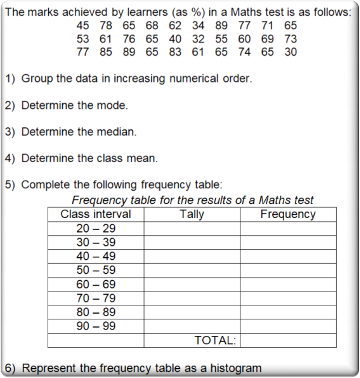

ID: 396/8-Statistics and Data
Titel: Process data appropriately to draw a histogram
Keywords:
Data intervals | mode | median | mean | frequency table



ID: 944/8-Statistics and Data
Titel: Interpretation of graphs: A discussion on how the data on these two graphs are linked together
Keywords:
Double bar cart | broken line chart


ID: 950/8-Statistics and Data
Titel: Interpretation of graphs - What to look out for when working with a question that requires conclusions to be drawn
Keywords:
Broken line chart






Grade 8: Statistics and data
Baseline tests:
Below all our online tests are listed. Click on the one that you have been enrolled for. You can also go back at any time to redo previous tests that you were enrolled for (we strongly
recommend that!)
Videos:
Below we list the
videos from our Back to Basics database. When you are enrolled with us you can click on any of the questions to see the video memorandum
Click on the "Play" button





Jimmy's 1% Law:
Spend 1% of your day (that is about 15 minutes) to work through these videos and Baseline tests, and your Maths will surely improve!

ID: Talking Textbook-Statistics and Data
Titel: Stem and leaf plots
Keywords:
Central tendency | dispersion
